Trout numbers in the Motueka River
Drift diving is used to determine the numbers of small, medium and large trout in the Motueka River.
Initially drift dives were carried out at Woodstock but in recent years a number of other sites have been included in the annual assessment of trout numbers. The graphs below show abundance (kg of fish/km of river) and counts of medium and large fish per km of river.
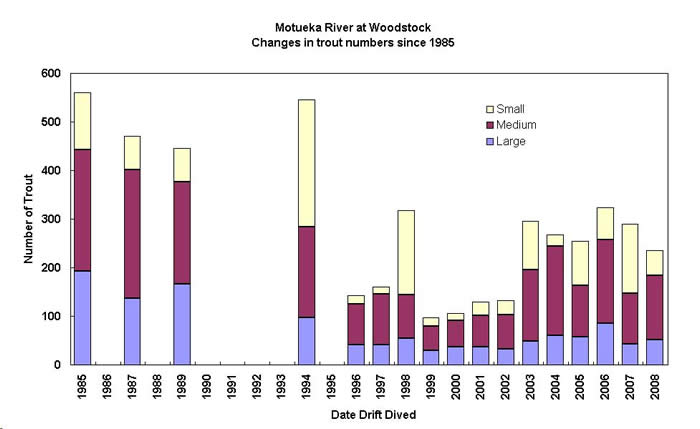
Updated drift dive data 1985 to 2008 (Fish & Game)
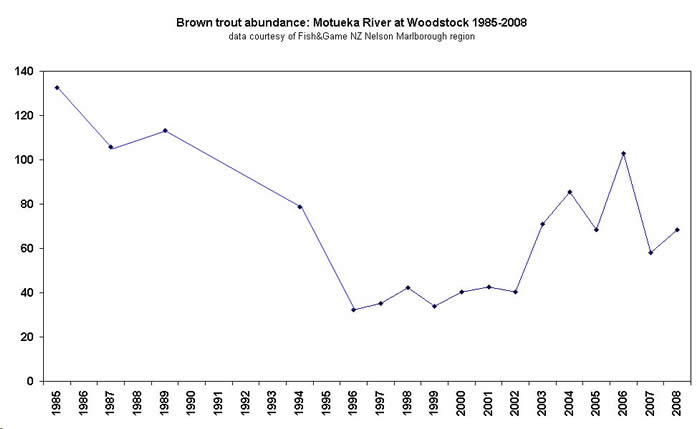
Figure 1: Brown trout abundance 1985-2008 (Fish & Game)
Results from randomly chosen drift dive sites in the main stem of the river tend to show a gradual downstream increase in trout abundance (Figs. 2 & 3).
Figure 2: Counts of medium and large trout per km of river at the 10 randomly sited drift dive reaches in the Motueka River
Figure 3: Abundance data for 2002, 2003, 2004 at the 10 drift dive sites. Note the similarities in 2003-04.
Drift dive surveys in the Wangapeka and Riwaka Rivers suggest declines in trout populations occurred in these rivers in the 1990s, although the timing may be diferent to that observed at Woodstock (Figs. 4 & 5).
Figure 4: Drift dive data from the Wangapeka River
Figure 5: Drift dive data from the Riwaka River