Faecal bacteria in the Motueka River and input to Tasman Bay - details
Storm events can mobilise and transport large amounts of contaminants from sources of pollution on land, threatening water uses downstream. Microbes such as bacteria, viruses, and protozoans of faecal origin that are mobilised during storm flows impact, particularly, bathing and shellfish harvesting (and shellfish aquaculture) in coastal waters that receive contaminated river plumes. NIWA staff based at Hamilton and Nelson examined faecal indicator bacteria, turbidity (water cloudiness) and flow in the Motueka River, in order to better understand sources and transport of faecal pollution and downstream effects. The Motueka River has a range of land uses over its 2000 km2 catchment, including pastoral farming which is expected to be the dominant source of faecal microbes in this river, rather than human sewage.
Continuous flow and turbidity are recorded continuously at Woodmans Bend near the mouth of the Motueka River (just upstream of Motueka), and an automatic sampler is located there as part of a network of sediment sampling stations. The autosampler is programmed to ‘trigger’ automatic sampling when river level rises above an operator-defined threshold. We intercepted autosamples collected for sediment analysis over storm events for a calendar year (2003-2004), and sub-sampled for analysis of the faecal indicator bacterium, E. coli as an index of faecal pollution. Regular (monthly) sampling for E. coli in the river was already underway (and is continuing).
The Motueka River is fairly unpolluted by faecal microbes compared to New Zealand rivers generally, with concentrations almost always suitable for swimming under baseflow conditions (Figure 1). However, as has been found elsewhere, faecal contamination levels were very much higher (E. coli bacteria concentrations 100 times or more higher) during stormflows (Figure 1), and tended to be higher on the rising limb of the storm events (when water was usually not suitable for swimming) than when water level was falling. Swimming during storm events is not recommended – and not just because of the microbiological status of the water!
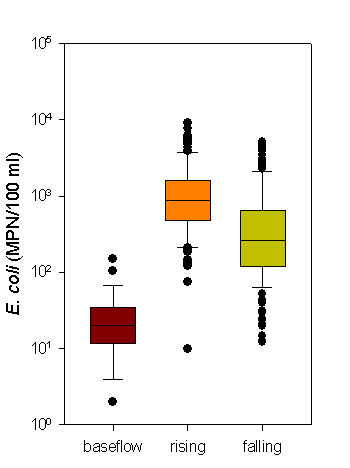
Figure 1. Boxplots of E. coli concentration for different flow conditions. The boxes enclose the middle 50% of the data, the medians are the lines enclosed by each box, and the ‘whiskers’ extend out to the 90th and 10th percentiles with more distant (‘outlier’) points represented by dots. A Ministry for Environment and Ministry of Health (2003) guideline for contact recreation in NZ is shown (230 E. coli/100 ml).
In similar studies in much smaller rivers in NZ (e.g., Davies-Colley et al., 2008), turbidity behaves similarly to faecal microbes over storm events, so the continuous turbidity record provides a means to estimate ‘continuous’ E. coli concentration. However, in the Motueka River, we found that E. coli peak concentrations always preceded turbidity peaks – which arrived at or after the flow peak. We think that the E. coli come mainly from the river bed from which they are eroded by accelerating currents on stormflow fronts, whereas the fine sediment causing turbidity arrives many hours later, having come from remote areas of the catchment where erosion is prominent. This ‘decoupling’ of turbidity and faecal contamination in the Motueka River meant that E. coli concentration had to be estimated from flow alone for the purpose of estimating faecal loads (McKergow & Davies-Colley 2008).
In similar studies in much smaller rivers in NZ (e.g., Davies-Colley et al., 2008), turbidity behaves similarly to faecal microbes over storm events, so the continuous turbidity record provides a means to estimate ‘continuous’ E. coli concentration. However, in the Motueka River, we found that E. coli peak concentrations always preceded turbidity peaks – which arrived at or after the flow peak. We think that the E. coli come mainly from the river bed from which they are eroded by accelerating currents on stormflow fronts, whereas the fine sediment causing turbidity arrives many hours later, having come from remote areas of the catchment where erosion is prominent. This ‘decoupling’ of turbidity and faecal contamination in the Motueka River meant that E. coli concentration had to be estimated from flow alone for the purpose of estimating faecal loads (McKergow & Davies-Colley 2008).
As we expected, almost all (98%) of the annual E. coli load (E. coli per year) delivered to Tasman Bay is exported during rainstorm events.
The NIWA E. coli data has been used to calibrate a model on river microbial dynamics developed by Jeremy Wilkinson, based, until recently, at Cawthron Institute. The model includes several processes thought to be important in microbial dynamics including livestock access to waters and runoff with overland flow, deposition to sediments, erosion from bottom sediments by accelerating currents, and microbial dieoff in waters - mainly by sunlight. Figure 2 compares measured E. coli (red points) at Woodmans Bend with model predictions. An interesting feature in this figure is the daily fluctuation of concentration at baseflow due to sunlight dieoff (e.g., during relatively low and declining flow on 23-24 September and 6-9 October, Figure 2). The river model is now being extended by Cawthron Institute to modelling the river plume in Tasman Bay so as to predict when faecal contamination impacts on bathing beaches and shellfish harvesting.
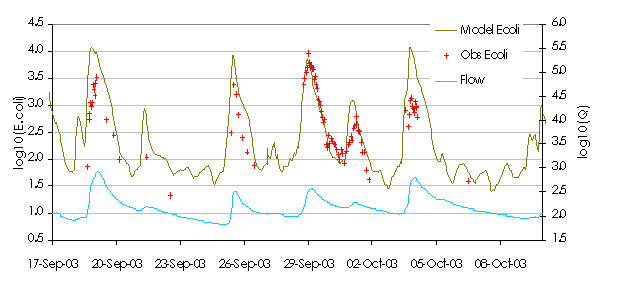
Figure 2. Predictions of E. coli concentrations by the Cawthron model (kaki line) compared with NIWA data (red crosses) at Woodmans Bend in the Motueka River. Also shown is the hydrograph (blue line indicating river flow). [From Wilkinson report]
References:
Davies-Colley, R. J. 2007: Faecal pollution from land sources flushed by storm flows. International Conference on Molluscan Shellfish Safety, Blenheim, New Zealand.
Davies-Colley, R. J.; Nagels, J. W.; Lydiard, E. 2008: Faecal bacterial dynamics and yields from an intensively dairy-farmed catchment. . Water Science and technology 57: 1519-1523.
McKergow, L. M.; Davies-Colley, R. J. 2006: Bugs ‘n Mud. E. coli, turbidity and flow relationships for the Motueka River. Presentation to the combined conference of the NZ Hydrological Society, NZ Assn of Resource Management and NZ Meteorological Society “Resource Management under Stormy Skies”, Christchurch 21-23 November. (Also presented to the annual conference of the NZ Microbiological Society, Christchurch, 18-21 November 2008.)
McKergow, L. M.; Davies-Colley, R. J. 2008. Storm dynamics and loads of faecal pollution in a large mixed land use catchment. Hydrological processes (submitted).