
Catchment Connections Issue 3, June 2008
In this issue:
STOP PRESS: If you missed the Country Calendar TV programme on the Motueka Integrated Catchment Management programme on 21 June 2008, the programme and a discussion with the producer can be viewed via http://tvnzondemand.co.nz/content/countrycalendar_2008_ep14/ondemand_video_skin?tab=CATCH UP
 Editorial
Welcome to Issue 3 of Catchment Connections.
Back in the 1970s river ecologists showed that river life and in-stream processes are intimately linked with conditions on the land upstream. Indeed, the health of a river system is indicative of the health of the surrounding catchment. Effects of unsustainable land management will often first become apparent in the waterways draining the land. The same situation is true for estuarine and coastal systems that ultimately receive the discharges from the land and are dependent on good water quality. More recent research confirms the tight linkage between the land and associated waterways and this is a key principle driving the need for integrated catchment management (ICM). Activities in one part of a catchment may have severe and unintended consequences elsewhere.
As water flows from the ridgetops to the sea it carries sediment, nutrients, organic matter, faecal bacteria and other contaminants. Some of these ‘passengers’ can have positive effects on the health and productivity of riverine, estuarine and coastal ecosystems, but many have negative effects if their concentrations are elevated beyond certain thresholds. The wide range of goods and services that we receive from these systems may also be threatened, as has been seen so regularly overseas.
The recent NZ State of the Environment report has noted the rapid change in intensity of land use over the last decade and the effects that this change is already having on our environment. Our freshwater ecosystems, in particular, are currently bearing the brunt of land use change and high commodity prices. At a coarse level the solutions to these problems appear obvious, but require changes in thinking, behaviour and approaches to catchment management. That’s where the main difficulties lie. We believe that ICM-type approaches that involve relevant science, sharing of knowledge, and effective engagement of all key players are vital for progress.
In this edition of Catchment Connections we demonstrate some examples of these elements from our work in the ICM research programme. Understanding of sediment sources and movements is a key to mitigating the common effects. Modelling is also an important component that can be used to predict the impacts of different scenarios and allow communities to design their future. Ideally, decisions on catchment management should be informed by good science. Knowledge is often out there, but inaccessible or difficult to absorb by the people that need it. The Motueka Toolbook represents an effort to make a large amount of information available and easily digestible, while our work on how science is accessed and used for decision making demonstrates the importance of informal networks within and among different agencies and a willingness to learn. Our regular ‘ICM out and about’ section also reports on Auckland’s ICM planning initiative to improve water quality and ecosystem health in the city’s urban environments.
| Roger Young, Cawthron Institute, Nelson |
ph +64 3 548 2319 ext 273 | roger.young@cawthron.org.nz |
How important are big storms for sediment generation?
 |
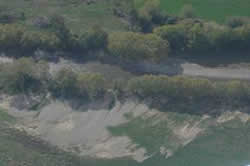 |
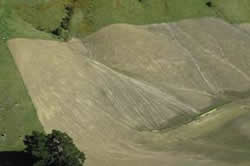
Fig. 1 Damage during the March 2005 storm: (top) severe erosion of a recently cultivated paddock; (bottom) gravel deposited on paddocks near the Motupiko River. |
The storm that hit the upper Motueka and Motupiko catchments in March 2005, dumping about 170 mm of rain in 4 hours, illustrates the dramatic effect that big storms and floods can have on catchment behaviour. While the storm was quite localised, its effects have extended all the way out to Tasman Bay and continue to be felt. At the time, roads were closed, some houses were isolated, one bridge was destroyed and there was a lot of damage to pasture and river control works (Fig. 1). While it was a big flood in the upper catchment (‘1 in a 100 year’), further downstream it was only a minor flood because much less rain fell in the Wangapeka River (a major tributary). Also noted at the time were very high levels of heavy metals deposited in Tasman Bay from the Motueka River and there were concerns about the effects this might have on fisheries in the bay (see following article). Now when you travel through the affected area it looks like it has completely recovered. However, data collected as part of our measurements of suspended sediment yield show the ongoing effect of the storm.
We have been monitoring suspended sediment yield at Motueka Gorge, Motupiko at Christies Bridge, Wangapeka at Walters Peak, and Motueka at Woodmans Bend since 2002. Our data show there is a strong relationship between storm-event peak flow and sediment yield (Fig. 2). We can use this to (1) provide an index of similarity for comparing different flood events, and (2) predict sediment yield from peak flow during storm events.
Following the March 2005 flood, sediment yields increased, particularly in the area most heavily affected by the flood but the effects extended all the way downstream to the Woodmans Bend site near the coast. Storm sediment yields increased by a factor of 20 at Motueka Gorge, by 6–7 in the Motupiko, and by 2–3 at Woodman’s Bend (Fig. 2). In the Wangapeka there was no comparable change in sediment yield. In effect, because of greater availability of sediment, there was a change in the relationship between suspended sediment concentration and flow (the ‘sediment rating curve’ that is often used to calculate sediment yield), which is normally assumed to be constant through time.
Over the 3 years since March 2005 the storm sediment yields have declined back to the values we were recording prior to the flood. We can use the relationship between storm-event peak flow and sediment yield to predict what the sediment load would have been if the relationship had remained constant through time. Figure 3 shows the relationship between predicted load and measured load and the rate of decline back to pre-flood values.
The data show the widespread and long-lasting effects of the flood, and also have some messages for science. Sediment yields are notoriously variable in space and time creating difficulties in getting accurate long-term estimates of sediment yield (such as might be required to estimate reservoir sedimentation), or in isolating the effects of contrasting land uses from short-term measurement programmes. The results depend very much on the storms that occur during any measurement programme. Consider the 42-year river flow record at Motueka Gorge. If we apply the pre-March 2005 peak flow to storm sediment yield relationship to the flow record then annual sediment yield is estimated at 94 t/km2. If, however, we incorporate the effects of large storms, annual sediment yield is estimated at 519 t/km2. This difference highlights the sensitivity of the long-term average sediment yield from a catchment to extreme events that perturb its erosion regime.
Fig. 2 Relationship between storm sediment yield and peak flow. The lines show the regression relationship fitted to data collected before the March 2005 storm. Note how data collected after March 2005 diverges from the regression lines at all sites except the Wangapeka.
Fig. 3 Ratios of measured event sediment yield and event yield predicted from pre-March 2005 relationship. Line shows exponential decay trend.
Reference:
Hicks DM, Basher LR 2008. The signature of an extreme erosion event on suspended sediment loads: Motueka River Catchment, South Island, New Zealand. Sediment Dynamics in Changing Environments (Proceedings of a symposium held in Christchurch, New Zealand, December 2008). IAHS Publ. 325.
Further information:
| Les Basher Landcare Research, Nelson |
ph +64 3 545 7708 | basherl@landcareresearch.co.nz | ||
| Murray Hicks NIWA, Christchurch |
ph +64 3 343 7872 | m.hicks@niwa.co.nz |
Links:
-
Sediment generation, delivery and impacts
https://icm.landcareresearch.co.nz/research/research.asp?theme_id=1&research_id=6
Tracing sediment from the mountains to the bay
The March 2005 flood that was centred in the upper Motueka River catchment (see Basher & Hicks, above) eroded significant amounts of sediment from a mineral belt region known as the Red Hills. These sediments were flushed into and through the main stem of the Motueka River with much of it reaching Tasman Bay. The Red Hills area is a band of ultramafic rock with high concentrations (compared with the surrounding rock formations) of certain metals, particularly nickel, chromium and copper. By investigating the concentrations of these metals in river margin sediments, we were able to show that the flood moved sediments from the Red Hills into and through the main stem of the river. The relative proportion of the various metals in Tasman Bay sediments provided a useful ‘signature’ for identifying the spatial extent of the influence of the Motueka River plume in the coastal environment.
River-margin sediments from the Motueka Gorge were over 20 times greater than recommended ANZECC (2000) guideline levels, suggesting ‘probable biological effects’ (Fig. 1). Although they became progressively more dilute further downstream as they were mixed with sediments from other parts of the catchment, they were still above guideline levels in the lower reaches of river. Metal concentrations in sediments from tributary streams were all found to be well below guideline levels.
Marine sediments were collected from a network of 24 stations in western Tasman Bay and analysed for a suite of 10 metals, using the University of Otago’s new ICP-MS facility. Results showed that the influence of the river plume extended out to around 7 km offshore from the river mouth (Fig. 2). The detectable sedimentation footprint covered an area of about 80 km2 with plume-affected nickel concentrations up to seven times higher than background levels in other regions of the bay. Macrofauna assemblages at the sites with the highest metal levels contained fewer species but greater abundances of opportunistic, disturbance-tolerant species such as Theora lubrica and the capitellid polychaete worm Heteromastus filiformis (Fig. 3). The changes in infauna community structure were found to correlate significantly with increased nickel, chromium and copper levels in the sediments.
Towards the end of the river plume sampling programme, a medium-sized flood event occurred in the Motueka River. Although the rainfall was not centred in the Red Hills area as in 2005, post-flood samples of marine sediments near the rivermouth (taken in the same locations as pre-flood samples) showed significantly increased levels of nickel and chromium. This suggests that metals-enriched sediments remaining in the river from previous flood events focused in the upper catchment are still being flushed out into Tasman Bay as pulse events during elevated river flows.
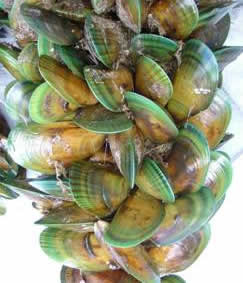
The boundary of the area of elevated sediment metal concentrations lies just inside existing spat-collecting and proposed mussel-farming areas in Tasman Bay. Considering that, following large floods, fine suspended sediments containing elevated levels of metals could be circulated into these areas, future research will need to investigate potential impacts on cultured and wild shellfish stocks.
Fig. 1 Concentrations of nickel and chromium in river-margin sediments. Bars in blue indicate samples down the main stem of the Motueka River; yellow bars are samples from tributaries.
Fig. 2 Spatial distributions of nickel concentrations (weak acid digested) in marine sediments of Tasman Bay.
Fig. 3 Spatial distributions of macrofauna abundance in marine sediments of Tasman Bay.
Further information:
| Paul Gillespie Cawthron Institute, Nelson |
ph +64 3 548 2319 | reid.forrest@cawthron.org.nz | ||
| Reid Forrest Cawthron Institute, Nelson |
ph +64 3 548 2319 | paul.gillespie@cawthron.org.nz |
Links:
- Long term in–situ data collection in Tasman Bay
https://icm.landcareresearch.co.nz/research/research.asp?theme_id=3&research_id=53
ECOPATH modelling of the marine food web
 |
Mussel aquaculture |
To assess the impact of increased shellfish aquaculture in the coastal environment around the Motueka River, the ICM Programme undertook ecosystem modelling to assess the redistribution of marine resources into shellfish aquaculture. Ecosystem modelling is a form of environmental bookkeeping that tracks the movement and distribution of energy resources in the form of carbon in marine foodwebs. This energy enters the system as solar energy and is transformed into complex, carbon-rich molecules that store that energy as microalgae (phytoplankton) in the water. This energy is then redistributed through the foodweb through predator, prey and detritus interactions (Fig. 1).
Data collected as part of the Motueka ICM Programme contributed to implementation of a linear food web model (ECOPATH) for undertaking investigations into the potential carrying capacity of ‘suspended bivalve culture’ (i.e. mussel farming) in the Nelson Bays. This was done to see what levels of culture might start to affect the existing ecosystem.
The ‘production carrying capacity’ represents the theoretical maximum bivalve culture that could be supported in the bay. This was defined as the point when the ecosystem collapses down to a nutrient–microalgae–mussel culture–detritus dominated system. The modelling exercise estimated annual production carrying capacity to be about 310 tonnes/km2 averaged across the bays. This tells us that introducing large-scale bivalve culture into Tasman Bay could disturb the ecosystem.
By contrast, the ‘ecological carrying capacity’ was defined as the level of culture that could be introduced without significantly changing the major energy fluxes or structure of the food web. The modelling exercise estimated this to be in the order of 65 tonnes/km2 per year averaged across the bays. This limit is well above proposed mussel culture levels for the Nelson bays and would not be expected to significantly alter ecosystem function.
Interestingly, with increased nutrient runoff (eutrophication) from changing land use becoming an issue in some areas of the world, shellfish culture is being investigated as a tool to assist the mitigation of human impacts in the marine environment because shellfish remove these nutrients from the system. The ECOPATH model also served as a basis for future research in the IDEAS modelling project, which sought to quantify the current impact of human changes from the Motueka catchment to the marine environment to check the risk of eutrophication occurring in this region. But that is another story.
Fig. 1 Marine foodweb represented in ECOPATH model.
Further information:
| Weimin Jiang Cawthron Institute, Nelson |
ph +64 3 548 2319 | Weimin.Jiang@cawthron.org.nz | ||
| Ben Knight Cawthron Institute, Nelson |
ph +64 3 548 2319 | Ben.Knight@cawthron.org.nz |
Links:
- Ecosystem models of Tasman & Golden Bays
https://icm.landcareresearch.co.nz/research/research.asp?theme_id=3&research_id=29
Modelling land-use effects on catchment water and nutrient fluxes
In the Motueka ICM Programme we have been using the SWAT (Soil and Water Assessment Tool) model to simulate the movement of water and nutrients through the catchment, especially with respect to changing land use. This has been done to provide a tool within the IDEAS framework that simulates the impacts of land use change across and within the catchment.
No model is perfect and there have been several difficulties with using SWAT. After some calibration the modelling of water yield worked well (Cao et al. 2006 – see links below). The simulations of different land-use change concentrated on differing levels of forestry in the catchment (fig. 1 of Cao et al. 2008, below) and showed that the current average flows and low flows are higher than prehistoric and for a scenario with massively increased forestry in the catchment (fig. 6 of Cao et al. 2008, below).
Fig. 1 Figures 1 and 6 from Cao. et al. (2008): Multi-criteria calibration and validation of SWAT in a large mountainous catchment with high spatial variability.
The modelling of nutrients and sediment has been challenging and is still not complete. We are confident that the nitrogen cycling and export functions within SWAT are working OK but have less confidence in the phosphorus and sediment yields. This is mostly due to the sediment generation algorithms being based on surface wash only and therefore ignoring the role of landsliding and bank erosion in providing sediment and phosphorus to the stream.
After calibration of the nitrogen outputs for measurements taken partway down the catchment (Woodstock – see Fig. 2), the model was run on an intensive-land-use scenario where intensive agriculture with high nitrogen input replaced the current sheep and beef operations and forestry was replaced by extensive sheep and beef grazing.
Fig. 2 Model calibration from data collected at Woodstock
The results showed that the average total nitrogen load in the river would increase by around 20% but it would be highly variable around the catchment (see Fig. 3). The largest percentage increase would be in the Motupiko subcatchment, which reflects relatively thin soils with a large potential for agricultural intensification.
Fig. 3 Modelled increases in nitrogen loading resulting from intensified land use.
The SWAT model has proved a useful tool for investigating land use scenarios; current work is around taking the outputs and combining them with ocean circulation models to see the impact of land use change on Tasman Bay productivity. This is being done as part of the IDEAS modelling framework.
Further information:
| Jagath Ekanayake Landcare Research, Lincoln |
ph +64 3 321 9656 | ekanayakej@landcareresearch.co.nz | ||
| Tim Davie ECAN, Christchurch |
ph +64 3 365-3828 |
Tim.Davie@ecan.govt.nz | ||
| Andrew Fenemor Landcare Research, Nelson |
ph +64 3 545 7710 | fenemora@landcareresearch.co.nz |
Links:
- Modelling water quantity and quality
https://icm.landcareresearch.co.nz/research/research.asp?theme_id=2&research_id=72
- Modelling impacts of land cover change on critical water resources in the Motueka River catchment, New Zealand

- Multi-criteria calibration and validation of SWAT in a large mountainous catchment with high spatial variability
Social learning
 |
Sediment learning group |
Social learning is an approach to working on complex environmental problems, particularly those with high degrees of uncertainty, lots of interested parties and disagreement around causes, effects and even desired outcomes. Many of the questions in catchment management fall into this category.
Interest in learning-based approaches in catchment management has increased steadily over the past 10 years as local government and agency efforts have moved beyond offering definitive, generally applicable packages of advice and recommendations on a ‘take it or leave it’ basis. The needs facing different regions and their rural families and communities vary widely. Catchment issues are always part of a larger ‘multistakeholder’ setting. Therefore, the translation of sound environmental ideals into concrete social practice must be the result of a joint effort, involving all the relevant actors. This translation of the sustainability principles into concrete action can be understood as a social or collective learning process involving all stakeholders related to a certain issue.
In this programme we are using social learning processes that aim to support institutions, organisations and knowledge with a view to applying the principles of integrated catchment management. Social learning processes take place at and between the interfaces of policymaking, research, and management. In a nutshell it is about creating situations where people can learn collectively to improve a situation. In terms of learning from our social learning efforts some things are becoming apparent.
In a broadbrush way some suggestions include:
- There is a need to use a facilitator (and the more different the stakeholder perspectives, the more important this is).
- The facilitator needs some independence from any particular solution.
- The capacity of stakeholder membership to learn differs (i.e. how open are people to different viewpoints, are they strategic or tactical thinkers, how much time do they have to put into the initiative?).
- Group size and composition are important.
Prominent ‘social spaces’ for collective learning processes in the research programme can be found in our regular community reference group meetings and interdisciplinary research initiatives. The Sediment Reference Group and AGMs also support social learning.
Further information:
| Margaret Kilvington Landcare Research, Lincoln |
ph +64 3 321 9714 | kilvingtonm@landcareresearch.co.nz | ||
| Will Allen Landcare Research, Lincoln |
ph +64 3 321 9600 | allenw@landcareresearch.co.nz |
Links:
-
Social learning (Motueka ICM research programme) https://icm.landcareresearch.co.nz/research/research.asp?theme_id=4&research_id=66
-
Collaborative learning (Landcare Research website) http://social.landcareresearch.co.nz
-
Community Reference Group
https://icm.landcareresearch.co.nz/research/research.asp?theme_id=4&research_id=31
Mātauranga Māori and cultural indicators for ICM
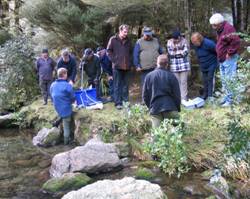 |
Cultural assessment using scientific and cultural indicator methods at Motueka and Riwaka catchments in 2007 and 2008. |
Understanding and incorporating tangata whenua perspectives, values, and knowledge into ICM is essential for achieving sustainable land and water management goals in New Zealand and for state of the environment reporting. A project developed by iwi in 2006 with the help of the ICM Programme has developed a framework assessment method and a suite of cultural indicators.
The cultural assessment tool is based on the cultural health index (CHI) first developed in the Taieri catchment, Otago, by Gail Tipa and Laurel Tierney in 2002. Gail and Laurel were invited to the Motueka and Riwaka catchments and ran a training workshop in early 2006.
The Nelson–Motueka pan-tribal regional resource management agency, Tiakina Te Taiao, have modified the original CHI forms into their own structure, descriptions and recording system. They adapted the CHI using a cultural framework that stratifies the landscape into Atua domains (Māori departmental gods – such as Papatuanuku, Ranginui, Tangaroa, and Tane Mahuta), cultural themes, indicators, and descriptors. All the information described from field assessment is site-recorded using maps, aerial photos, and given precise grid coordinates – and sometimes located using a global positioning system (GPS). A scoresheet is then filled out by trained iwi members and can be entered into Tiakina Te Taiao’s Geographic Information System (GIS) based at Whakatu Marae in Nelson.
Many of the river and stream sites assessed by iwi correspond to sites where freshwater scientific indicators have been measured and recorded.
Tools, techniques and lessons
The cultural indicators work is central to and underpins a large number of iwi projects in the region. Most importantly it articulates Māori values of natural and cultural capital and aspirations of tangata whenua to provide a strong cultural perspective of environmental and cultural change in the Motueka, Riwaka, and other catchments in the region. Because of the significant interconnection between Māori and natural and cultural resources it makes a statement about how local Māori see their environment, well-being, and relationship with the environment changing through time. A number of tools, techniques and lessons have resulted from this indicators work and could be applied in other catchments both in New Zealand and internationally. Therefore this cultural indicators research in ICM:
- Provides consistent methods and tools for cultural monitoring and assessment
- Can be used to measure progress towards or away from tangata whenua goals, aspirations, and perceptions – such as ideals of desired states of environmental health and well-being
- Underpins iwi projects such as cultural impact assessments and restoration projects
- Provides a wealth of mātauranga Māori (Māori knowledge) for iwi knowledge and information systems such as GIS
- Provides information on trends – whether an environment or ecosystem is getting better or worse from a cultural perspective
- Articulates iwi Māori values, issues, and knowledge to stakeholders, such as councils, industry, communities, and science groups (e.g. CRIs, other institutes)
- Complements science indicator assessment and links cultural research to science research
- Provides information that can be used collectively for improved decision-making for sustainable land and water management and for state of environment reporting
- Can support modelling, visualisation, and futures planning
This work has been instrumental for articulating cultural perspectives of freshwater in the Motueka catchment, and provides a pathway for exploring and discussing iwi aspirations, futures, and decision making towards sustainable management of environmental, social, economic and cultural resources.
The development of iwi-led and iwi-issue-driven collaborative projects such as cultural monitoring is an important incubator for building capacity for iwi and hapu researchers, scientists and stakeholders. Collaborative projects such as this contribute to building strong long-term iwi–science partnerships and increase iwi engagement and interaction in ICM science objectives. They also facilitate a move towards transdisciplinary research where knowledge is created, discussed, and understood from various world-views.
Further information:
| Garth Harmsworth Landcare Research Palmerston North |
ph +64 6 353 4972 | harmsworthg@landcareresearch.co.nz |
Links:
-
Indigenous knowledge and values (Landcare Research website)
http://www.landcareresearch.co.nz/research/sustainablesoc/social/indigenous_index.asp -
Māori and ICM
https://icm.landcareresearch.co.nz/research/theme.asp?theme_id=2 (Freshwater)
Learning by design rather than default
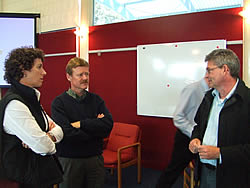 |
Andrew Fenemor, Will Allen (Landcare Research) in discussion with Gillian Wratt (Cawthron) at the 2006 ICM Annual Meeting |
‘What did you learn at school today?’ is the standard home-coming question for countless children, but far more rarely the family question when we return home from work. Is this because learning has become jaded? Or not even on the radar of the workplace? A more likely explanation lies in information overload.
Global statistics point to the mass of advertising messages, emails, podcasts, printed and electronic reports – that more new information has been produced in the last 30 years than the last 5,000 years. And we are addicted to more; a survey by UK Henley reports that more than 70% of people ticked the survey box saying ‘I can never have too much information’. Yet more than half also said they did not have the time or energy to use the information that they already have. (‘Enough – breaking free from the world of more’, John Naish, 2008, pp. 15–16).
Harvard-based developmental psychologist Robert Kegan and author of In over our heads: The mental demands of modern life describes us as ‘already the most over-informed, under-reflective people in the history of civilisation’ and highlights a ‘limited conception of leadership and learning that is the unwitting heir of the information age’ (How the way we talk can change the way we work – seven languages for transformation, R Kegan and L Lahey, 2001, Epilogue).
The Motueka ICM Programme has been a seedbed for learning about learning – in a multi-organisational setting. We attended to learning practices at an individual and group level, between groups in an agency (‘organisational learning’), at the interface between science and policy, and across the multiple partners in the ICM (‘institutional learning’). We built a working model of how institutional learning is (or is not) happening.
What became clear was that the challenge was not ‘uptake’ nor even the capacity to absorb what was available, but for groups to sustain their follow-through actions. What became clear was that what we originally framed as the challenge of ‘science uptake’ was a naïve framing of the process. The challenge was not that management agencies and sector groups lacked information. The shortfall was a capacity to absorb what was available – and to act on that. Kegan et al. distinguish the fundamental and common barrier: ‘in spite of all the knowledge of what organisations need to know to succeed, a missing link is our lack of sufficient know-how to diagnose and disturb the immune systems that prevent organisations from making changes’ (Kegan et al. p. 232). We learnt of the cycle of learning and unlearning – the capacity referred to by M Scott Peck (The road less travelled and beyond, 1997) as balancing: ‘The essence of the discipline of balancing is unlearning and “giving up” something in order to consider new information.’
In the institutional learning project we distinguished four primary dimensions of institutional learning. We distinguished recurrent ‘stops’ to learning (thresholds) that recurred, with different character, at the individual, group, organisational and institutional levels. We developed some interventions, practices, and design approaches and tested these in Tasman and elsewhere. We have mapped our work in learning to a practice model that is able to draw on resilience theory (Resilience thinking, sustaining ecosystems and people in a changing world, Brian Walker and David Salt, Island Press, 2006). We noticed familiar stable states, thresholds, fore-loop (observing to visioning) and back-loop (intention to action) sequences, and explored how change at one level can shift the system state at another level.
We compared our institutional learning model to Frances Westley’s work on social innovation (Getting to maybe – How the world is changed, Vintage Canada, 2007), which provides clues to ‘where next’ in design and application. The real value of this work – now applied in other projects around New Zealand – is to learn how to take local initiatives to scale. That is where our focus is now. Our appreciation of the short article ‘Using emergence to take social innovations to scale’ by Margaret Wheatley and Deborah Frieze (Berkana Institute, 2006) has led to a collaborative relationship and an opportunity to take our design learnings to a global learning network. We have worked with international collaborators to review the theoretical base.
Of practical local application, we have generated a series of design principles and approaches that can be applied by councils and cross-sectoral groups to significantly enhance learning in complex settings: practices, ways to develop the requisite capabilities, and alternative approaches to learning infrastructures. The Motueka ICM was the seedbed and practice field for this work, while the fruits have been applied in many other programmes around New Zealand including the development of nutrient trading instruments with multiple institutional partners in Lake Rotorua, and in the development of the New Zealand Emissions Trading Framework. While there are common principles, every situation is different. There are no ‘cookie cutter’ approaches to learning in a complex setting – but a principle-based design approach with a theoretical and practice-based foundation is far more robust than the ‘seat of pants’ approach that is widely taken in complex institutional settings.
The two points of leverage in learning are simple: What is my (or our) intention? Where shall I put my attention?
Four questions to focus your learning attention in an institutional setting are:
- What is our shared purpose here?
- What do I think I might learn from (x)?
- I wonder whether they see the same meaning in this as I do, and what might they see as possible?
- Who am I becoming in this process? In what way am I seeing with new eyes and hearing with new ears? (These last questions are evidence of transformational learning).
And work with a learning intention. At the start of every day (week, month, project, year) ask – what might I learn today? And at the end of each day ask, review – what did I learn today? And start a conversation about it somewhere relaxed, with no cellphones, email or media.
Further information:
| Glen Lauder CommonGround New Zealand |
mobile +64 21 513161; ph +64 4 387 2611 |
glen.lauder@commonground.co.nz |
Links:
-
Research notes from the Institutional Learning project are posted on the ICM website:
https://icm.landcareresearch.co.nz/research/research.asp?theme_id=4&research_id=43
ICMPs in the Auckland Region
Stormwater is recognised as having a large impact on the Auckland Region’s freshwater and marine ecosystems with flow-on adverse impacts on the social, cultural and economic values of the regional community (Boston Consultancy Group 2004). Furthermore, one of Auckland’s greatest challenges is to enable growth to occur in the region while maintaining and enhancing the quality of life and the environment.
Since 2004, the Auckland Regional Council (ARC), through the Stormwater Action Plan, has provided contributory funding assistance (i.e. subsidies) to territorial authorities to prepare integrated catchment management plans (ICMPs). The main focus of ICMPs in the Auckland Region is urban areas. Outside the metropolitan urban limit ICMPs represent mixed-land-use catchments with urban subcatchments. A number of these catchment plans are addressing both urban and rural issues.
To qualify for ARC funding an ICMP must address flooding, stream management, stormwater and wastewater network discharges and consented point-source discharges within existing urban areas or areas that may be urbanised in the future, in accordance with District Plan zonings and the Regional Growth Strategy (ARC 1999).
An ICMP must ultimately identify the best practicable option for managing stormwater and wastewater at the catchment level, taking on board the purpose of the Resource Management Act 1991 and city-wide priorities established through the Long Term Council Community Plan (LTCCP). The LTCCP is a requirement of the Local Government Act 2002 (Fig. 1).
ICMPs are closely linked to other planning documents prepared under the Resource Management Act and Local Government Act. A developing ICMP must link to other planning documents, such as those illustrated in Fig. 1. ICMPs are non-statutory documents that may support network discharge consent applications, District Plan changes, LTCCPs etc.
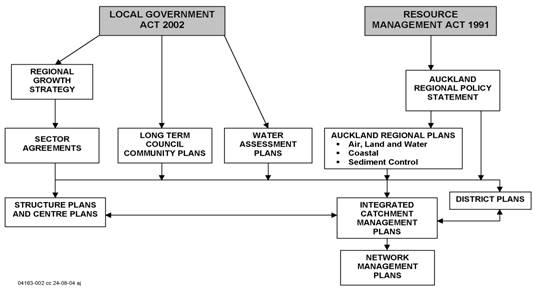
Fig. 1 Relationship between Auckland regional and district planning documents affecting stormwater and wastewater management (Auckland Regional Council 2005).
Catchment management planning is an ongoing process. Therefore the ARC facilitates ICMP workshops and training sessions, and seeks to introduce useful tools to help in the preparation of cost-efficient and effective plans.
References:
ARC 1999. Auckland Regional Growth Strategy: 2050. Auckland Regional Council internal report. 81 p.
ARC 2005. ICMP funding eligibility guideline. Auckland Regional Council internal report. 56 p.
Boston Consultancy Group 2004. Auckland Regional Stormwater Project. An action plan to deliver improved stormwater outcomes. Auckland Regional Council internal report. 48 p.
Further information:
| Claudia Hellberg Auckland Regional Council |
ph +64 09 366 2000 ext. 8440 | claudia.hellberg@arc.govt.nz |
Links:
-
Stormwater: Integrated Catchment Management Plans (ICMPs)
www.arc.govt.nz/environment/water/stormwater/integrated-catchment-management-plans-icmps.cfm
ISSN 1178-5799