Water quality monitoring results
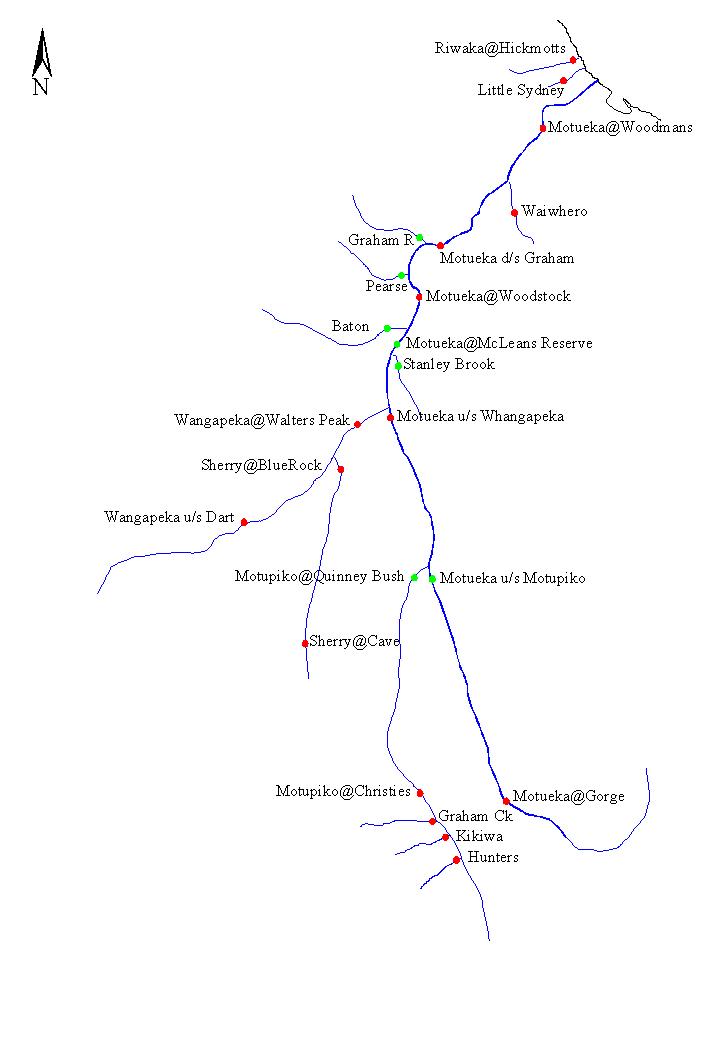
A monitoring network to determine the state of the freshwater environment at a range of localities within the Motueka River catchment was established. Sites included a range of catchment sizes, geologies and climatic regimes. Monthly results are listed at the bottom of this page.
Details are summarised in the Tasman District Council's "State of the Environment Report" produced in 2005 ![]() (2.0 MB). An update to this report is expected late in 2009.
(2.0 MB). An update to this report is expected late in 2009.
Monitoring Network Sites
Note: monitoring moved to 3-monthly from October 2001.
Site |
Grid ref. | Size | Land use | Geology | |
| *Kikiwa Stream | N29 978 500 | Small | pasture | Moutere Gravel | |
| *Hunters Gully | N29 987 480 | Small | native forest | Moutere Gravel | |
| *Graham Creek | N28 965 508 | Small | exotic forest | Moutere Gravel | |
| Little Sydney Creek | N26 084 144 | Small | horticulture | Complex/Granite | |
| *Waiwhero Creek | N27 042 021 | Medium | pasture | Moutere Gravel | |
| *Wangapeka River(u/s Dart) | M28 805 764 | Medium/Large | native forest | Granite | |
| *Sherry River (u/s Cave Creek) | M28 850 684 | Small/Medium | exotic forest | Granite | |
| *Lower Riwaka (@ Hickmotts) | N26 086 155 | Medium | horticulture | Karst | |
| *Sherry River (u/s Wangapeka) | M27 880 810 | Medium | pasture/dairy | Granite | |
| **Motueka River (@ Gorge) | N28 027 527 | Mainstem upper | native | ultramafic | |
| *Motupiko River (@ Christies) | N28 939 542 | Major Trib | pasture/exotic | Moutere grave | |
| Motueka River (u/s Wangapeka) | N27 926 860 | Mainstem, mid | |||
| *Wangapeka (@ Walters Peak) | N27 902 851 | Major Trib | native/exotic/pasture | Complex/Granite | |
| **Motueka (@ Woodstock) | N27 951 943 | Mainstem, Mid/Lower | |||
| Motueka (d/s Graham) | N27 965 993, | Mainstem, Lower | |||
| *Motueka (@ Woodmans Bend) | N27 067 096 | Mainstem, Bottom | |||
*Sites in original TDC regional monitoring plan
**Sites monitored monthly by NIWA as part of National Water Quality Monitoring
Network.
The parameters measured at these sites are mostly the same except that Campylobacter, E. coli, and total suspended solids are not measured by NIWA.
Results
Detailed monthly results are available for 2000 until 2003 at which stage monitoring moved to 3-monthly.
| Year 2003 | ||||
| February | April | July | Nov - Dec | |
| Year 2002 | ||||
| January | April | July | October | |
| Year 2001 | ||||
| January | February | March | April | May |
| June | July | August | September | October |
| Year 2000 | ||||
| October | November | December | ||
A technical report has also been prepared (Tasman District Council Ref: R05007 and Cawthron Report No. 933, June 2005) by Roger Young (Cawthron Institute), Trevor James (TDC) and Joe Hay (Cawthron Institute) presenting results of the Tasman District Council’s “State of the Environment” Surface Water Quality Monitoring Programme from 1999 to April 2004, the executive summary of which is below.
The report incorporates monitoring data collected by National Water Quality Network (NIWA) from 1989 to 2003 and other data including data collected as part of the ICM Motueka programme.
Executive summary
As part of its obligations under the Resource Management Act, Tasman District Council monitors the state of surface water quality and river health at selected sites throughout the Tasman District. Data from this monitoring programme and selected information collected as part of scientific studies carried out by other agencies in the District are reviewed in this report.
A range of water quality parameters have been measured at most sites on a quarterly basis at base flow since 1999. Samples of aquatic macroinvertebrates have been collected annually since 1999 at most of the water quality sampling sites. Some types of macroinvertebrates are tolerant to pollution while others are not. Therefore, the presence or absence of particular macroinvertebrate species can indicate the ecological health of a site. The amount and types of periphyton (or algae) growing on the river bed is also indicative of river health and has been measured quarterly at most of the water quality sampling sites since 2001.
A cluster analysis of the water quality results identified three groups of sites. One group consistingof eight small streams had poor water quality. These sites (subsequently labelled as the “red” sites) have poor water clarity and high concentrations of nutrients and faecal indicator bacteria compared with other sites in the District and often exceed water quality guidelines. Dissolved oxygen concentrations were low at times at some of these sites. All of these sites are on small streams draining land that has been intensively developed for agriculture, horticulture, or urban usage. Sites in this group include: Motupipi, Watercress and Winter Creeks (near Takaka), Little Sydney and Waiwhero Creeks (near Motueka), Kikiwa (upper Motueka) and Reservoir Creek in Richmond. A second group of 11 sites (subsequently labelled as the “yellow” sites) have better water quality than the red sites, but tend to have lower water clarity and higher concentrations of nutrients and faecal bacteria than that in the high quality (“green”) sites. The yellow sites include small streams and the downstream end of moderate sized rivers that drain intensively developed areas. Sites in this group include: lower Riwaka, lower Sherry (near Tapawera), Mangles (near Murchison), lower Onekaka (Golden Bay), lower Wai-iti (near Brightwater), Motupiko (upper Motueka catchment), Black Valley (in St Arnaud), and Kaituna (near Collingwood).
The remaining “green” sites had the highest water quality and included forested headwaters and also the downstream reaches of the District’s large rivers. Sites in this group include: Motueka, Takaka, Aorere, Buller, Matakitaki, Waimea, Wairoa, Wangapeka.
Sites draining low elevation land had higher concentrations of TN, NO3-N, NH4-N, DRP, TP, E. coli, and suspended sediments than sites draining hill country, mountains or flowing from a lake. Oxygen saturation was lowest in first order streams. Concentrations of nutrients also tended to be highest in the smaller streams. Concentrations of nutrients, E. coli and suspended sediment at sites classified as having pastoral land cover were higher than at sites with indigenous forest or exotic forest land cover. Similarly, water clarity was lower at pastoral sites than in forested sites. The effects of land use on water quality are widely recognised and the results of this analysis are consistent with earlier nationwide studies of water quality patterns.
Continuous water temperature records were available for 23 sites, mostly within the Motueka River catchment. Data from well-shaded headwater streams never exceeded the temperature criteria for protecting ecosystem health during the summer. However, the water temperature criterion was regularly exceeded during summer at sites on small unshaded streams draining developed land (e.g. Waiwhero, Little Sydney, Kikiwa). The temperature criterion was also regularly exceeded in the lower reaches of the Tadmor and Motueka rivers.
Trends in water quality were determined at the three National River Water Quality Network sites (Motueka at Gorge, Motueka at Woodstock, Buller at Longford) where sampling has been conducted monthly since 1989. Concentrations of ammonium nitrogen declined at all three sites over the course of the data record, whereas concentrations of total nitrogen increased at all three sites. Water clarity also tended to increase at all three sites, including the Gorge site, which is upstream of any human land use, over the course of the data record. The fact that these changes were consistent among all three sites suggests that this trend is related to climatic changes, rather than changes in land management. However, nitrate nitrogen concentrations and conductivity increased significantly at the Motueka at Woodstock site over the course of the data record, but not at the other sites, suggesting that these changes may be related to changes in land use within the Motueka Catchment over the last 16 years.
Macroinvertebrate communities indicated good ecosystem health at the majority of the sites that were sampled. However, ecosystem health appears to be poor in many of the small lowland streams that drain the intensively developed parts of the District (e.g. Motupipi River, Watercress Creek, lower Reservoir Creek, Waiwhero, Little Sydney). These sites were also identified as having poor water quality.
Periphyton communities were also indicative of good ecosystem health at the majority of sites. However, again the small lowland streams draining intensively developed land often had excessive accumulations of nuisance algae.
In terms of water quality, the Tasman District is lucky because all of the District’s large rivers have a significant proportion of native forest in their catchments. Therefore, any inputs of pollutants from developed land in the middle and lower reaches are substantially diluted by the large volume of high quality water from upstream. The main threats to water quality and stream health in the Tasman District relate to the intensification of agriculture in the District, and to a lesser extent the expansion of residential development in the District. The main problems with water quality in the Tasman District are currently found in small streams which drain intensively developed land.
Restoration efforts should focus on reducing nutrient and faecal bacteria inputs to these systems. Efforts should also be made to increase the amount of bank-side vegetation along these streams to provide shading and keep water temperatures below the critical levels required for protecting ecosystem health. If improvements can be made to the water quality of many small streams, this will also lead to cumulative improvements in the quality of water in the main rivers.
Along with physical and chemical indicators, results from macroinvertebrate and periphyton indicators are presented.
The report highlights freshwater quality issues and outlines what Tasman District Council is doing to help improve water quality where it is found to be poor.
The report can be obtained from Trevor James at Tasman District Council.
Tasman District Council
189 Queen Street
Private Bag 4
RICHMOND