
Catchment Connections Issue 5, June 2009
In this issue:
 Editorial
 |
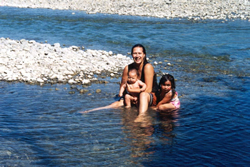
Maori children’s art depicting a sustainable future, rich in life, from the Waiapu catchment project, Gisborne East Coast, 1998–2003. |
Welcome to Issue 5 of Catchment Connections.
Kaua e rangiruatia te hā o te hoe; e kore tō tātou waka e ū ki uta. “Do not lift the paddle out of unison or our canoe will never reach the shore.” This whakatauki illustrates the importance of working together to achieve goals and desired outcomes.
Tēnā koutou katoa. I write this editorial in a time of worldwide economic recession. It is also a time when many believe we are on the verge of a planetary environmental disaster that, unlike the economic recession, will not be short lived and where the long-term survival of human beings is increasingly questioned. We continue to work in a world of mainstream economic models that have increasingly driven over-consumption, excessive debt, and this present financial crisis; that exponentially increase waste and pollution, degrade ecosystems, and support resource exploitation as a basis for growth and prosperity – and this is unlikely to change. Many now refer to the once clean biosphere as the anthroposphere because of this extensive global modification.
What gives me hope, however, is the number of people I have met during my many years in science and research who are contributing so much to enhancing the quality of the natural and modified environment in which we live. The ICM programme, as an example, has generated an exciting range of integrated projects and tools with the aim of taking the lessons from a small catchment in New Zealand to a much wider audience nationally and internationally. It has brought me into contact with many dedicated people who are focussed on using holistic and integrated approaches to understand the ‘big picture’ and to think differently from other angles. This philosophy has supported us exploring and utilising knowledge systems from other world-views and perspectives and integrating these with science.
The Māori world-view is to seek balance in all systems and understand the inter-connections of all components, which requires (w)holistic and integrated understanding to achieve healthy environments and healthy people. Māori have always measured their own well-being and health through the quality of their physical, cultural, and spiritual environment. Māori engagement in resource management activities is still strongly based on Māori values and knowledge, such as kaitiakitanga and manaakitanga, along with the legislative requirements and frameworks Māori work in, such as the RMA 1991. Māori preferences and priorities from a cultural perspective are seen as primary ways to act and behave towards the natural environment, achieve Māori goals and aspirations, build Māori capacity, improve human health and wellbeing, and grow strong and resilient communities.
The ICM philosophy sits comfortably with the Māori worldview – at whatever scale. It is an excellent philosophy for catalysing change and mobilising people of all cultures towards active citizenship, collaboration, future visioning, integrated knowledge systems, the understanding of interconnection, cumulative effects and consequences, and the articulation of desirable outcomes. There is much to learn by looking at the world through a different lens – a different worldview – as we continue to pursue goals for healthy catchments, healthy people, and ultimately a healthy planet.
He kura tangata, e kore e rokohanga; he kura whenua ka rokohanga. “Human possessions and people will not remain, a treasured land will endure and be sustained.”
Garth Harmsworth, Maori research, ICM research programme
| Garth Harsmworth Landcare Research, Palmerston North |
ph +64 6 353 4972 | harmsworthg@landcareresearch.co.nz |
Links
- Maori and ICM
- Indigenous knowledge and values (Landcare Research website)
- Other Catchment Connections newsletters
Linking scientific and cultural indicators of river health
Maori values and a healthy environment are integral to Maori well-being and health.
There is an increasing need for accurate and reliable information about our environment and also increasing recognition of the need to include different perspectives in monitoring programmes. The Resource Management Act (RMA 1991) emphasises the importance of the relationship of Māori with their environment and requires decision makers to have particular regard to kaitiakitanga – which means understanding the Māori world view.
Cultural indicators help articulate cultural values, assess the state of the environment from a cultural perspective, and help establish a role for Māori in environmental monitoring. In this work we reviewed the philosophies behind cultural and scientific monitoring of river health and compared the results from the two approaches at sites where corresponding data were available.
Iwi/hapū groups from the Motueka Catchment have adapted a cultural health index developed in the Otago region by Gail Tipa and Laurel Tierney, and applied it at sites throughout the Motueka and Riwaka catchments. The Motueka cultural health index stratifies the landscape into Atua domains (a Māori cultural framework) of Tangaroa, Tane Mahuta, Haumietiketike, Rongomatane, Tūmatauenga and Tawhiri Matea (Fig. 1). Attributes covering riverbank condition, riverbed composition, water clarity, water flow, water quality, channel shape, riparian vegetation, catchment vegetation, river modification/use, use of river margins and smell are scored from 1 (poor) to 5 (excellent), with the overall cultural stream health measure calculated as the average of these scores. An assessment of the mahinga kai status and traditional status of the site is also determined, along with a judgement of whether iwi would return to the site.
Scientific monitoring of river health has been conducted throughout the Motueka catchment for several years. Site selection for the regular cultural health monitoring by a group of iwi members in the Motueka/Riwaka catchments was conducted with knowledge of the existing network of water quality monitoring sites, but selection also reflected strong cultural interest and cultural issues, and therefore some additional sites were chosen. Many of the sites overlap (Fig. 2), allowing a comparison of the results from the two approaches.
Results of links between science and cultural indicators showed there was a strong correlation between the cultural stream health measure and the percentage of the catchment above each site in native forest, and also weaker relationships with water clarity, a macroinvertebrate community index (SQMCI), and the concentration of faecal indicator bacteria (Fig. 3). These relationships confirm that both science and cultural indicators are successfully capturing aspects of river and stream health and together providing a fuller picture of river health. When comparing guidelines associated with the scientific data it was apparent that the cultural stream health assessments imposed stricter standards across many criteria, reflecting strong Maori perspectives and preferences for very high environmental standards.
The scientific approach is robust, objective, and quantifiable, and uses methods and equipment that are well tested and reviewed but often costly. Scientific methods can measure precise changes in river and stream health over time and generally require a high degree of professional expertise and experience. The cultural approach tends to be more qualitative, (w)holistic, and subjective, being mainly based on acquiring in-depth cultural and environmental knowledge of a local environment (e.g., mātauranga Māori, local and historical knowledge). In comparison to science approaches the cultural approach is generally cost-effective.
Cultural methods rely on collective skills/knowledge held by tangata whenua but also require a high degree of training and consistency in the assessment approach in order to record, measure and detect long-term changes and trends in a given environment. This work in the ICM programme has shown that scientifically and culturally based monitoring and assessment, along with community-based approaches, can provide an enriched and complementary understanding of freshwater systems, founded on shared learning. Each approach offers a slightly different worldview that can be extrapolated to other parts of the environment. With this complementary framework, different forms of assessment and monitoring can be used side by side by local government, community, iwi and hapū, and research agencies. No particular group is excluded from working across a range of assessment types, although a certain level of expertise and specialist knowledge is required within each.
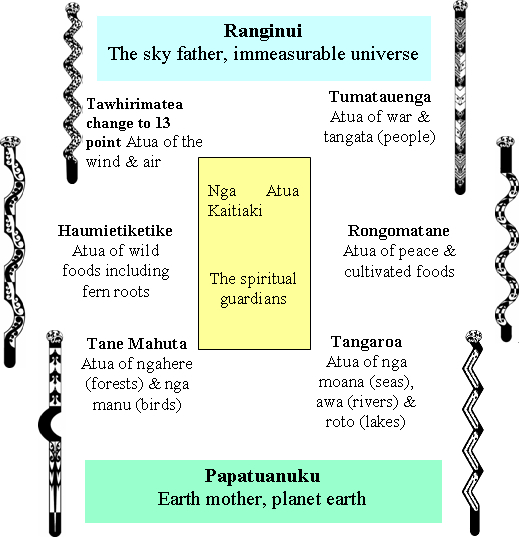
Fig. 1 Atua (departmental gods) domain framework. (Source: Tiakina te Taiao, Dean Walker)
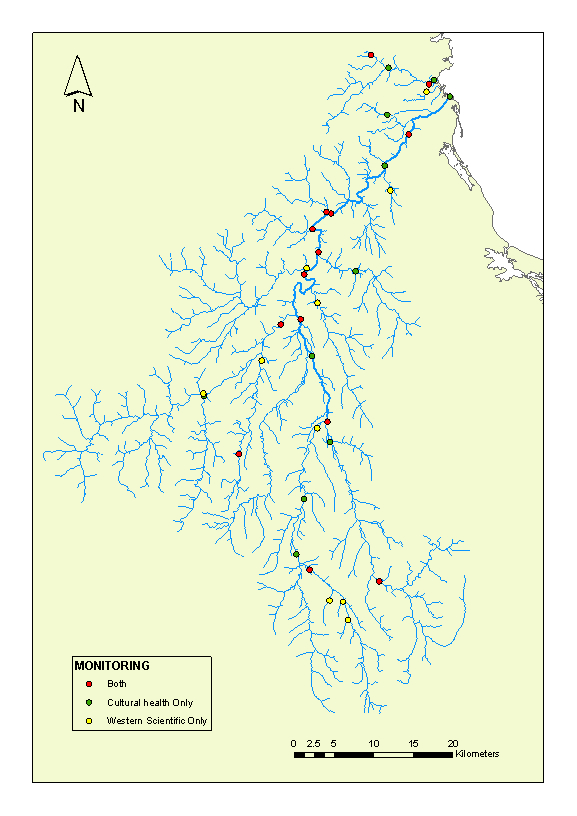
Fig. 2Map of the Motueka Catchment showing monitoring sites and the type of monitoring undertaken at each site.
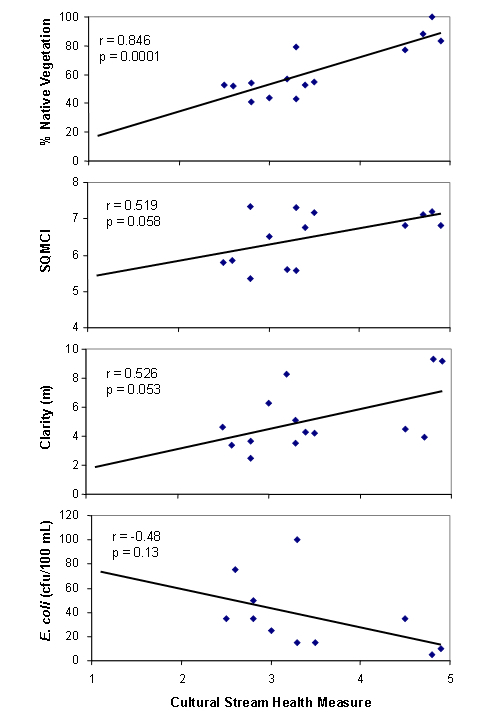
Fig. 3 Relationship between cultural stream health measure and % native vegetation in the catchment upstream, the semi-quantitative version of the macroinvertebrate community index (SQMCI), water clarity, and concentration of faecal indicator bacteria (E. coli).
Further information:
| Garth Harsmworth Landcare Research, Palmerston North |
ph +64 6 353 4972 | harmsworthg@landcareresearch.co.nz |
| Dean Walker, Tiakina te Taiao Ltd, Nelson |
ph +64 3 546 9412 | |||
| Roger Young Cawthron Institute, Nelson |
ph +64 3 548 2319 |
Links:
- Links between scientific and cultural indicators of river health
- Linkages between cultural and scientific indicators of river and stream health
Faecal bacteria in the Motueka River, and input to Tasman Bay
Storm events can mobilise and transport large amounts of contaminants from sources of pollution on land, threatening water uses downstream. Microbes such as bacteria, viruses, and protozoans of faecal origin that are mobilised during storm flows will impact on bathing and shellfish harvesting (and shellfish aquaculture) in coastal waters that receive contaminated river plumes.
In conjunction with Cawthron and Landcare Research, NIWA staff have examined faecal indicator bacteria, turbidity (water cloudiness) and flow in the Motueka River, to understand better the sources and transport of faecal pollution and downstream effects. The Motueka River has farming, forestry and conservation land uses over its 217 km2 catchment, with pastoral farming rather than human sewage expected to be the dominant source of faecal microbes in this river (e.g., as found in the Sherry subcatchment).
Flow and turbidity are recorded continuously at Woodmans Bend near the mouth of the Motueka River (just upstream of Motueka), and an automatic sampler is located there as part of a network of sediment sampling stations. The autosampler is programmed to ‘trigger’ sampling when river level rises above an operator-defined threshold. Samples were collected for sediment analysis over storm events during 2003 and 2004, and sub-sampled for analysis of the faecal indicator bacterium, E. coli as an index of faecal pollution. Monthly sampling for E. coli in the river was already underway and is continuing.
The Motueka River is fairly unpolluted by faecal microbes compared with New Zealand rivers generally, with concentrations almost always suitable for swimming under baseflow conditions (Fig. 1). However, as has been found elsewhere, faecal contamination levels were very much higher (E. coli bacteria concentrations 100 times or more higher) during stormflows (Fig. 1), and tended to be higher on the rising limb of the storm events (when water was usually not suitable for swimming) than when water level was falling. Swimming during storm events is not recommended – and not just because of the microbiological status of the water!
In similar studies in much smaller rivers in NZ, turbidity behaves similarly to faecal microbes over storm events, so the continuous turbidity record provides a means to estimate ‘continuous’ E. coli concentration. However, we found that E. coli peak concentrations in the Motueka River always preceded turbidity peaks – which arrived at or after the flow peak. We think the E. coli come mainly from the river bed, from which they are eroded by accelerating currents on stormflow fronts, whereas the fine sediment causing turbidity arrives many hours later, having come from remote areas of the catchment where erosion is prominent. This ‘decoupling’ of turbidity and faecal contamination in the Motueka River meant that to estimated faecal loads E. coli concentration had to be estimated from flow alone.
As we expected, almost all (98%) the annual E. coli load (E. coli per year) delivered to Tasman Bay is exported during rainstorm events.
The E. coli data have been used to calibrate a model on river microbial dynamics. This Faecal Indicator Organism (FIO) model includes several processes thought to be important in microbial dynamics, including livestock access to waters, microbial deposition to sediments, microbial erosion from bottom sediments, and microbial dieoff in waters mostly associated with sunlight. Figure 2 compares measured E. coli (red points) at Woodmans Bend with model predictions. An interesting feature in this figure is the daily fluctuation of concentration at baseflow due to sunlight dieoff (e.g., during relatively low and declining flow on 23–24 September and 6–9 October, Fig. 2). The river model is now being extended to modelling the river plume in Tasman Bay to predict when and where faecal contamination is expected to affect bathing beaches and shellfish harvesting.
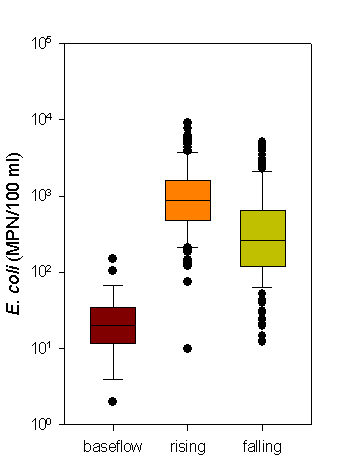
Fig. 1 Boxplots of E. coli concentration for different flow conditions. The boxes enclose the middle 50% of the data, the medians are the lines enclosed by each box, and the ‘whiskers’ extend out to the 90th and 10th percentiles with more distant (‘outlier’) points represented by dots. A Ministry for Environment and Ministry of Health (2003) guideline for contact recreation in NZ is shown (230 E. coli/100 ml).
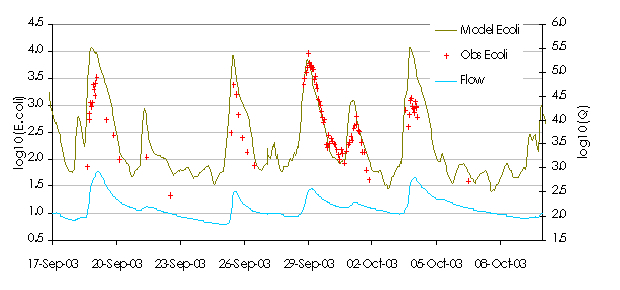
Fig. 2 Predictions of E. coli concentrations (green line) compared with observed data (red crosses) at Woodmans Bend in the Motueka River. Also shown is the hydrograph (blue line indicating river flow).
Further information:
| Rob Davies-Colley, NIWA, Hamilton |
ph +64 7 856 1725 | r.davies-colley@niwa.co.nz | ||
| Roger Young Cawthron Institute, Nelson |
ph +64 3 548 2319 | roger.young@cawthron.org.nz | ||
| Paul Gillespie Cawthron Institute, Nelson |
ph +64 3 548 2319 | paul.gillespie@cawthron.org.nz |
Links:
- In-river faecal bacteria dynamics
- Faecal Indicator Organism model
- McKergow, L. M.; Davies-Colley, R. J. 2008. Storm dynamics and loads of faecal pollution in a large mixed land use catchment. Hydrological processes (submitted).
Measuring fine sediment abundance on river beds
|
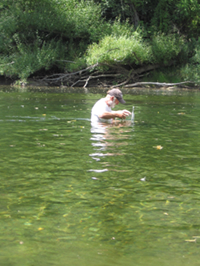
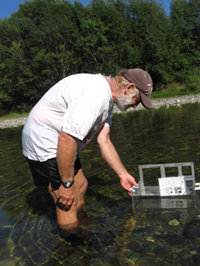
Fig 2 (a & b) Measuring fine sediment abundance using plastic viewer and comparator chart. |
As part of the ICM programme we’ve developed a rapid technique – Fine Sediment Abundance (FSA) – to describe variation in the amount of fine sediment on a river bed. This will be useful for State of the Environment monitoring and can complement biological surveys such as macro-invertebrate index studies or drift dives measuring trout numbers.
The FSA method has been developed and tested in the Motueka River, widely recognised for the quality of its brown trout fishery. In the mid-1990s trout numbers declined dramatically and remained low for almost a decade (Fig. 1). Some attributed this to the effect of fine sediment in the river. However there are neither data, other than anecdotal accounts, to support the claim that sediment caused the decline in the fishery, nor any standard method of describing variation in the amount of fine sediment in rivers.
We use a structured, class-based visual assessment technique. It is only applied to runs because they are the areas that will be most impacted if sediment supply increases and they are the only habitat that can practically be sampled in large deep rivers like the Motueka (Fig. 2a). We have 31 sampling sites throughout the catchment and once each year make an assessment of the proportion of fine sediment at points along several transects across the stream at each site. The number of transects and number of observation points per transect vary according to stream width. The start point of each transect is accurately located by GPS allowing repeat measurements to be made at the same location each time.
We record the proportion of fine sediment (<2 mm particle size) using class intervals of <1%, 1–5%, 5–10%, 10–20%, 20–50%, and>50%. A plastic viewer is used to allow a clear view of the bottom of the river and a comparator chart to aid sediment class identification (Fig. 2b). At least 100 observations at each site are recorded directly into a datalogger connected to the GPS. All sampling is done under low flow conditions and only the wetted area of the channel is characterised. From the raw data, the frequency of occurrence of each % fines class is calculated at each site and converted to the % frequency to allow comparison between the sites.
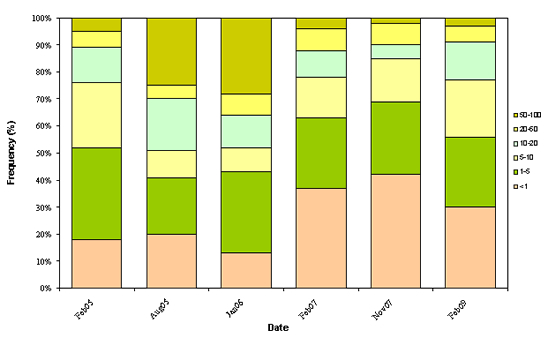
At most sites the proportion of fine sediment is very low. Approximately 75% of all observations recorded at the sites have <5% fine sediment and only 7% have >20% fines (Fig. 3). The average % fines ranges from 41% to <1%. A small number of sites had greatly elevated amounts of fine sediment and all of these sites drained areas dominated by Separation Point granite (Fig. 3). We have repeated the survey several times at all sites and most have changed very little. However, at Motueka Gorge observations following a ‘50-year’ flood in March 2005 show substantial changes in the proportion of fines in the river bed and indicate the survey method is able to track changes effectively in the percentage of fines (Fig. 4).
The FSA survey method is an efficient and effective way of providing information on the spatial and temporal variation in the proportion of fine sediment on the river bed where relatively large changes are anticipated. To collect 100 measurements at most sites took between 1 and 2 hours. It does not require highly skilled personnel or expensive equipment (Fig. 2a). The method is flexible and can be applied to both small streams and large rivers (Fig. 2b). The method has been adapted by Environment Canterbury in their state-of-the-environment monitoring in Canterbury.
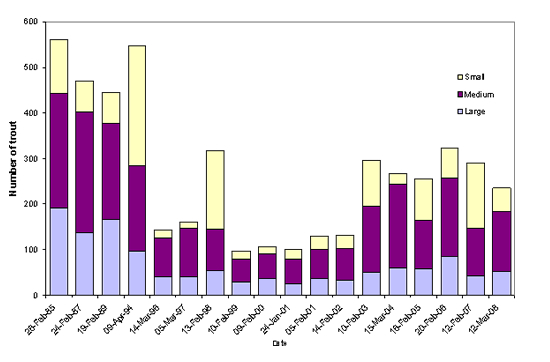
Fig. 1Changes in number of trout at Woodstock since 1985
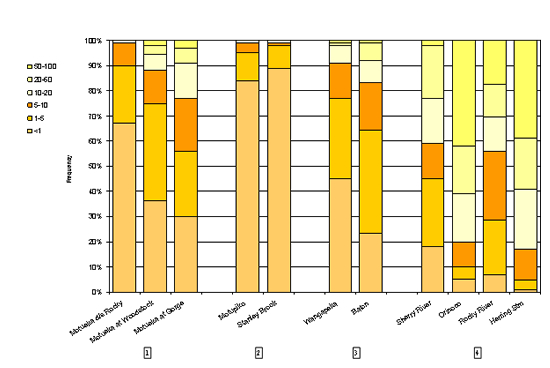
Fig. 3 Spatial variation in amount of fine sediment in Motueka river. At sites in groups 1 (main stem), 2 (large eastern tributaries), and 3 (large western tributaries) most observations have <1 or 1–5% fine sediment. Group 4 (small west and east bank tributaries) has much higher amounts of fine sediment.
Further information:
| Les Basher Landcare Research, Nelson |
ph +64 3 545 7708 | basherl@landcareresearch.co.nz |
Links:
- Substrate charactertisation
- Conceptual requirements for an erosion-sediment model for the Motueka catchment
Native riparian plants for riverbank stabilisation
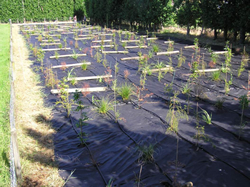 |
Fig. 1 Plant trial site near Gisborne |
Stream bank erosion is a natural geomorphic process that occurs in all channels. It is one of the mechanisms by which a channel adjusts its size and shape to convey the discharge and sediment supplied to it from the surrounding land.
Where bank erosion is required to be controlled, it is achieved with either structural measures (concrete structures or rip rap (large boulders)) or by planting trees at the river edge or on the banks. Vegetation is widely accepted as a key factor in contributing to a stream bank�s stability. In general terms, vegetation roots increase bank stability by protecting soils against entrainment from flood flows, and root mass and density provide soil shear strength and thereby protect against gravity collapse of undercut banks.
The most commonly used species used to control bank erosion in New Zealand is salix (willow). However, in the last two decades, there has been interest in moving away from introduced species to using more native species, particularly on smaller streams. There are, however, concerns that native plants will not perform as well as willows and the information to allay these concerns does not yet exist or is sparse.
Over the last 8 years, we have been looking at the above- and below-ground growth characteristics of native plants used for stream bank plantings. The first trial, completed in 2004, consisted of riparian colonisers and the second trial (Fig. 1), which began in 2006 and has another year to go, is looking at podocarps and a few non-woody species.
Ten specimens of each species are extracted each year and measurements are made of tree height, canopy spread, stem diameter at breast height (DBH), root collar diameter, root depth, root spread, root length by diameter size class and
with reference to the stem, and both above and below-ground biomass.
As a general rule, below-ground biomass (roots including the bole) comprises about 25% of the total plant biomass of woody species, while the above-ground biomass (stem, branches, and leaves combined) comprises the remaining 75%. The most significant gains in plant biomass occur between ages 3 and 4 years. In terms of root spread, at age 4 years, the root systems of woody species are generally confined to within a 50-cm radius (1-m diameter spread) of the stump, the exception being titoki, which had a spread of 1.5 m. In contrast, at age 3 years the roots of carex, toetoe, and flax had root spreads of up to 4 m.Perhaps one of the most surprising findings to date has been that the total length of roots greater than 1 mm in diameter (we refer to these as structural roots) of non-woody species is an order of magnitude greater than those of the woody species. For example, a 3-year-old carex secta plant had 959 m of structural roots, a 3-year-old toe toe had 694 m compared with a 4-year-old titoki at 64 m (Fig. 2). Imagine nearly 1 km of roots sitting below a carex plant � no wonder they are hard to dig out of the garden!
Unlike some of the introduced species commonly used for erosion control (e.g., willows and poplars), the root systems of many native species that we have trialled are relatively compact, with roots evenly distributed around the stump and occupying all sectors of the soil. However, they tend to be shallower rooted. These differences in the spread and depth attributes of roots between plant species will help determine the appropriate species mix, optimal planting densities and the time required to achieve effective soil stabilisation in erosion-prone areas. These data will ultimately be incorporated into a new slope-stability model that factors in plant�soil relations.
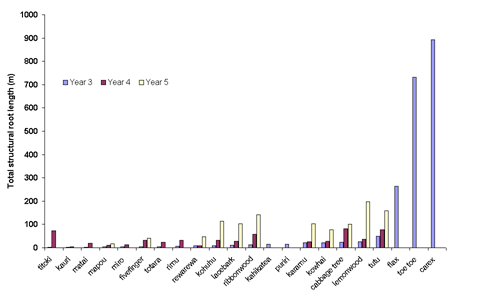
Fig. 2 Structural root length for some native plants at ages 3, 4, and 5 years.
Further information:
| Michael Marsden Landcare Research, Gisborne |
ph +64 6 863 1345 | marsdenm@landcareresearch.co.nz | ||
| Chris Phillips Landcare Research, Lincoln |
ph +64 3 321 9775 | phillipsc@landcareresearch.co.nz |
Links:
Modelling sediment generation from landslides
Land and water managers are increasingly seeking to use models to manage erosion and sediment impacts, and predict the impacts of land-use change on sediment delivery to waterways. One of the key requirements in erosion models that regional council staff identified in workshops in 2006 was to be able to identify the key sources of sediment generation and predict how changes in land management affect these sources.
The NIWA-led Raglan/Whaingaroa Fine Sediment Study is providing a focus for developing integrated process-based models of sediment delivery from the land, transfer down the stream network, and dispersal and deposition in estuaries. Shallow landsliding is an important process for sediment generation at Raglan (Fig. 1) and we have completed development of a computer model (as a component of the SHETRAN model) that simulates sediment generation and delivery to streams by this process.
The model is based on infinite slope stability analysis and requires information on rainfall, topography, and soils to predict how the water table rises in the soil during rainstorms and causes slopes to fail by landsliding (Fig. 2). Accurate prediction of water table depth is an essential requirement for the model to work well (Fig. 3) and a field experiment has provided data to test the predictions from SHETRAN (Fig. 1). Part of the instrumented slope failed in August 2007 (Fig. 2) after a long wet period and provides a complete record of the variation in soil moisture and water table position during a landsliding event.
This type of model requires large amounts of data to calibrate and verify and is not very useful for management purposes. A parallel development designed by NIWA will take output from such detailed models and incorporate it in a decision support tool called CESIT (Catchment to Estuary Sediment Interactive Tool). This will provide a tool targeted at resource managers in regional councils for managing impacts of land-derived sediments in estuaries. A key feature of CESIT is that it allows the user to define and manipulate mitigation measures in the catchment, and then to see the implications for environmental outcomes in the estuary.
Estuarine and coastal sedimentation is a key issue in many parts of New Zealand. Development of models that simulate the full range of erosion processes and predict the transfer and fate of sediment arriving at the coast will allow more accurate assessment of the downstream consequences of land-management change. They will help us identify the main contributing processes and ensure mitigation efforts are effectively targeted.
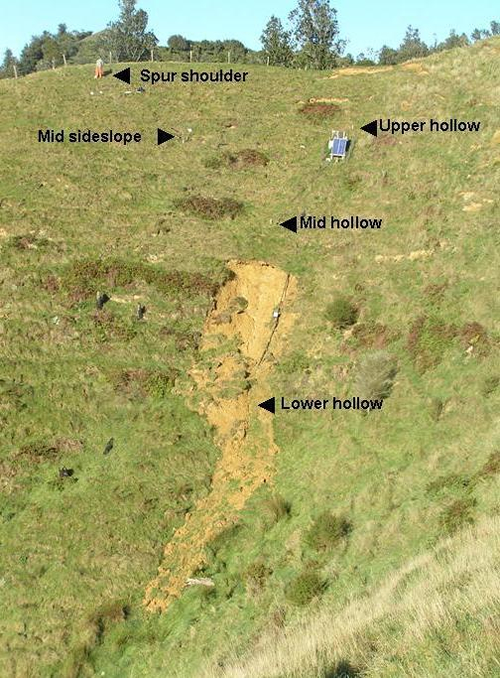
Fig. 1 Hillslope hydrology experimental site showing location of instruments (capacitance probes and TDR indicated by ►) and small landslide that has occurred at the site.
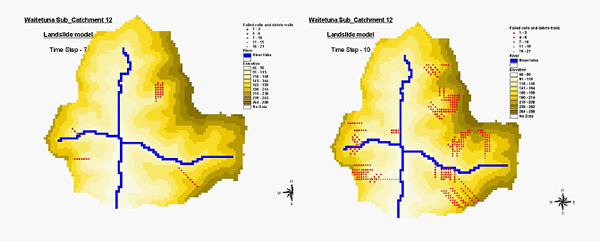
Fig. 2 Output from landslide model showing failed grid cells and debris tails (red) at 2 time steps in a model simulation when watertable is at 0.4 (left) and 0.1 m (right) below ground surface.
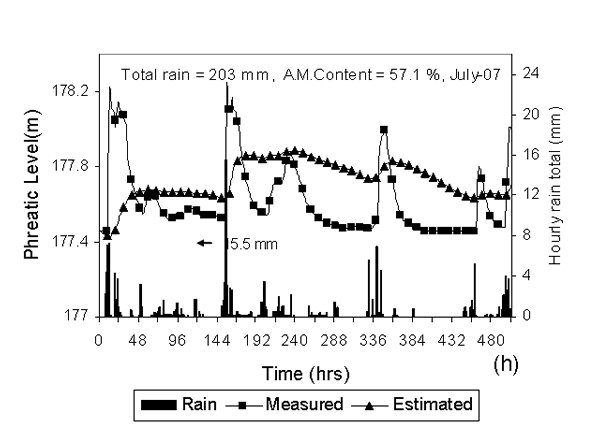
Fig. 3 Measured and predicted water table depth during a series of storms in July 2007.
Further information:
| Les Basher Landcare Research, Nelson |
ph +64 3 545 7708 | basherl@landcareresearch.co.nz | ||
| Jagath Ekanayake Landcare Research, Lincoln |
ph +64 3 321 9656 | ekanayakej@landcareresearch.co.nz | ||
| Sandy Elliot NIWA, Hamilton |
ph +64 7 856 7026 | selliot@niwa.co.nz |
Out and About
Linking science with policy � where did it all go wrong?
There is an oft told tale about a balloon-load of policy makers getting lost in fog. As they slowly descended to the ground they were fortunate enough to come upon a group of scientists carrying out field work. “Where are we?”, asked the policy makers, to which the scientists replied, “41° 30’ 45”S and 172° 10’ 35”E”. The policy makers took off in their balloon grumbling, “Typical, ask a scientist a simple question and they answer in a way unintelligible to everyone else”, while the scientists grumbled, “Typical, a policy maker asks you a question, you answer it, and they’re not happy”.
A key integration in Integrated Catchment Management (ICM) is between science and policy – so how well linked is New Zealand environmental science with policy? When you consider that all Regional Councils have science staff and many Crown Research Institutes have staff with interests in policy matters, at the superficial level at least there should be a very strong linkages. And yet there are many calls made that science and policy are not linking well. Too much science doesn’t meet the needs of environmental management agencies and Regional Councils are not expressing their needs well enough for science agencies to direct their research in the right direction.
Figure 1 shows an idealised description of how some generalised environmental variable will change with time in response to a policy implemented by an agency such as a regional council. In the diagram there are several clear areas where science plays an important role:
- Providing the robust methodology to monitor the environmental variable
- Providing guidance on what the quality objective should be
- Developing and testing tools to affect the change required by policy
- Developing and testing models which predict how much behavioural change is required to meet the policy objective.
All these are areas where New Zealand science has been actively targeted in the past 10 years and where there have been significant advances. From a Regional Council perspective, however, three of these areas are still unsatisfactory: guidance on the quality objectives (2), and the uptakes of tools and models (3 and 4).
Looking first at the guidance on what the environmental quality objective should be, two problems here make this difficult. First, it sometimes feels like nailing jelly to the wall when you try to get a group of scientists to give a clear opinion on what an environmental quality objective should be. The most common answer seems to be: give me some more money (gelatine?) and I’ll try and answer the question. While there are often good reasons for the lack of unanimity it is frustrating for the policy maker who would be quite happy with accepting a 70% certainty. The second difficulty is that to establish the quality objective it is first necessary to establish what values you are trying to protect. Often these values are not easily defined and may be societal values that change with time and/or the group consulted most. Once we start to define the values the question starts to shift from straight biophysical science into social science and a new set of skills is required. This is part of correctly phrasing the question on what environmental quality objective is needed. As regional council staff we need to work hard to make sure we ask the question we really want answered.
With the development of mitigation tools or predictive models the biggest problem environmental managers face is deciding which is the best and most cost effective for their particular issue. This is where publicly funded science could and should provide help to Regional Councils. Too often advice on which tool or model to use leads to capture by a science agency with a particular barrow to push or intellectual property right to protect. This is not a satisfactory outcome for Regional Councils and may lead to later challenges in hearings and courts over whether the best approach really has been used. There is a real need for independent testing of models and mitigation tools with the results being publicly available to all potential users. This is something science has done well for environmental measurement techniques (1 in list above) but far less openly for tools and models. This type of testing does not necessarily lead to the adoption of one model or tool above all others, it is more likely to lead to a recognition of the diversity and how one model or tool can work particularly well in one situation but not in another. This will give the environmental manager powerful knowledge to effect the change desired by particular policies.
Underlying all the phases shown in Figure 1 is the issue of uncertainty and how we deal with it. How do we account for the known variability in our measurements when setting the environmental quality objective? What do we do when we know the measurement technique has inherent errors and assumptions that lead to uncertainty? How certain are we that the proposed mitigation measures will be effective in delivering the policy outcome, especially if there is a significant cost involved? These are all questions of uncertainty that need investigation by science providers. However, there is also a more fundamental issue. At a recent science symposium at Environment Canterbury there was considerable discussion about the issue of uncertainty. It quickly became apparent that there were major differences as to what was meant by the term “uncertainty”. It is rather like “sustainability” – a frequently used term that means many things to many different people. Before issues of uncertainty are addressed in science research programmes there needs to be a clear definition of which aspect of uncertainty is being dealt with.
Returning to the balloon-load of policy makers still lost in the fog. How could the encounter have worked better? First, the policy makers could have better refined their question by putting it in context. Where were they trying to get to and in what time frame? Then the scientists could have provided some tools to interpret the latitude and longitude readings more easily. That might have been a map or a GPS with an inbuilt GIS – both would have been effective in different ways, depending on how far they needed to go and how much money could be spent. It would have been nice to have the options clearly laid out so an objective choice could be made.
The use of the word “integrated” in ICM has two major connotations – a consideration of spatial integration within a catchment that covers cumulative effect, and integration of community, science and policy within a catchment to provide effective management. Science provides a framework for policy as set by an environmental management agency that then provides a framework for the community to make every day decisions on land and water use. When these work together we are achieving ICM. The link between science and policy is a major challenge but there is no doubt the integration needs to be made and ICM offers a structure to do so.
Note: the views expressed here are the personal opinions of the authors and do not represent any formal policy position taken by Environment Canterbury.
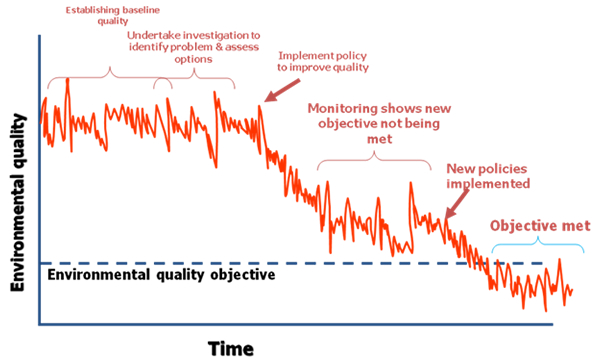
Fig. 1 Idealised timeline of policy implementation to meet an environmental objective.
Further information:
| Tim Davie Environment Canterbury |
ph +64 3 372 7084 | tim.davie@ecan.govt.nz | Ken Taylor Environment Canterbury |
ph +64 3 372 7084 | ken.taylor@ecan.govt.nz |